Monday, 20 October 2014

Tax is good for you

Liam Brunt and Cecilia García-Peñalosa offer a provocative take on State capacity, urbanization and the onset of modern economic growth:
We argue that the First Industrial Revolution occurred in England in the middle of the 18th century precisely because it was uniquely urbanized before 1750.

This is something of an oversimplification of the paper’s case: Britons, or more precisely English farmers, produced more because they had to pay out more than foreign growers in rent, tithe and taxes. This forced them to produce more food, thereby supporting larger urban populations whose increased volume and range of economic and social interactions favoured intellectual exchange and innovation. The proposition is attractive in that it draws together the phenomena of agricultural growth, urbanisation and demand-driven and/or technology-led industrialisation. But could agrarian rents really be a driver of urban industry? It’s a lovely thought amid today’s welter of tosh about voting and property rights, but is it a speculation too far?

Brunt & García-Peñalosa seem on solid ground so far as the productivity-urbanisation relationship is concerned. Adam Smith said something similar in 1776:

As subsistence is, in the nature of things, prior to conveniency and luxury, so the industry which procures the former must necessarily be prior to that which ministers to the latter. The cultivation and improvement of the country, therefore, which affords subsistence, must, necessarily, be prior to the increase of the town, which furnishes only the means of conveniency and luxury. It is the surplus produce of the country only, or what is over and above the maintenance of the cultivators, that constitutes the subsistence of the town, which can therefore increase only with the increase of this surplus produce.

As we might expect, higher food output per worker indeed tends to be associated with a larger proportion of townspeople, though an admittedly rough estimate for principal products – albeit one based largely on later data – yields a rather more urban Holland, Belgium & Italy and a more rural Wales, Hungary & Romania than might be suggested by agricultural productivity alone (presumably indicating sizeable food imports among the former group and exports of grain and livestock from the latter).

The authors’ analysis starts by overstating a point that isn’t entirely irrelevant to their analysis, and might usefully have been improved upon:

China, which is regarded by many historians as the most technologically advanced country in the Middle Ages, had much higher urbanization rates than Europe around the year 1000, with about 3 per cent of the population living in cities in the former and virtually zero in the latter. However, over the next 700 years Western Europe experienced a massive increase in urbanization rates, reaching almost 10 per cent by the year 1700, whilst no substantial change took place in China.

This is over-egging the pudding somewhat. The authors’ dismissal of extravagant claims for China’s urbanisation is welcome, and they are right to note that while Europe forged ahead in the following centuries, China struggled to add a single percentage point. But while Europe’s urban population around 1000 was still struggling to recover from its post-Roman low, it certainly wasn’t zero, even in the then relatively peripheral north-west. There are grounds to think that western Europe wasn’t so far behind China, especially if one adopts a lower urban population threshold than the authors’ preferred 10,000 (the cut-off point for de Vries’s city-by-city study): the proportion was lower in north-western Europe, but still not far short of the Continental average. China had more big cities with its sophisticated imperial administration and advanced internal communications, but Europe contained many smaller regional centres, trade emporia and former Roman capitals in varying states of decay or repair. At a more appropriate urban threshold of 2,000 the Europe-China differential would all but disappear.

So perhaps western Europe on the eve of its 11th-century revival wasn’t quite such a backwater in the urbanisation stakes, despite the continent’s relative economic frailty. Just as importantly, by 1300 or even 1200 Europe – however defined - may well have been already ahead, a crucial point lost in comparing only the beginning and end of the 700-year period. This doesn’t invalidate the authors’ case, and may even support it: exactions at the expense of Europe’s cultivators had doubtless increased in the 11th-12th centuries as emerging monarchies and feudal elites jockeyed for advantage. But while overall urbanisation remained low, more precise dating of Europe’s lead underlines the need to look at the medium as well as the long term, and to seek possible explanations of the “Great Divergence” also at times well before the 18th century.

Urbanisation is only one step in the analysis, though a key one in that it is seen as a proximate motor of Europe’s technological revolution. The cornerstone of the authors' argument is the link between agrarian extraction (effectively rent, since this is the main difference between the English and Chinese rates) and the agricultural productivity growth which made large urban populations sustainable. In trying to identify something approaching a “take-off”, however, Brunt & García-Peñalosa seem to have allowed their enthusiasm for English agricultural growth to get the better of them:

Clark finds an increase in output per worker of 44 per cent between 1700-09 and 1770-79. Moreover, Clark documents that output per worker already rose sharply in the 16th and 17th century, increasing fivefold between 1500 and 1650.

A fivefold increase in output per worker in 1500-1650 is of course out of the question, not least given an intervening increase of only around five percentage points in the urbanisation level. Fivefold pre-industrial productivity growth would in any case surely be anathema to Clark’s neo-malthusian heart, necessitating a compensating population increase to soak up the surplus output. In fact Clark finds a productivity drop of about a quarter, not entirely implausible against a background of rapid population growth and the resulting reversal of the land windfall occasioned by the excess mortality of the 14th and 15th centuries. My own estimates suggest a modest rise in labour productivity in the two centuries before 1650, and an increase of a third or so in 1700-70, the latter closer to Brunt (2000) than Clark. For the following century, though, Brunt & García-Peñalosa seem needlessly cautious in their estimates – a rise of a mere fifth when population and trade data suggest an improvement of three-fifths or more. That debate will doubtless run and run, sustained by the high 18th-century output estimates which Clark derives from his series for land rent, wages and capital inputs.

Again, none of this disproves the paper’s basic premise, but it raises once more the issue of timing. There seems to have been nothing exceptional about the level of rural exactions in the latter half of the 18th century when England outstripped its continental rivals in urbanisation (or rather most of them, a significant qualification) and industrialisation: the burdens faced by growers had been in place for at least a couple of centuries, for much of which time provincial urbanisation had been sluggish. Agricultural advance was, like urban growth, a gradual process. But the greatest increases in both agricultural productivity (though not aggregate output) and urbanisation would come in the following century.

The next element – leaving aside the matter of state capacity, not entirely convincingly dealt with (I remain unpersuaded that this correlates with high agrarian rents) – is the scale and impact of compulsory extraction from agriculture:

In table 4 we report the tax burden on agricultural workers in England and China in c.1775, which was almost 100 times greater in England. Since output per worker was around ten times higher in England than in the typical Chinese province, the tax rate was around ten times higher in England than China.

Here again, some of the data seem questionable (“tax” here includes rent and tithe, but that’s clearly indicated). Given that output per English agricultural worker was only perhaps £35 in the 1770s – equivalent to four or five tons of grain – it’s difficult to imagine a Chinese peasant producing a mere tenth as much, still less sharing it among family, landlord, tax-collector and buyers. Chinese productivity was certainly a good deal behind, but a more accurate ratio would seem to be around a third, even lowering Perkins’s generous per capita grain allowance (based as it is on the best years of the 1950s rather than the perhaps more representative 1930s). Nor is the authors’ estimate of 47 pence for China’s land tax per man in agriculture entirely convincing: this might have been the amount going to the Imperial coffers, but other estimates suggest a burden perhaps three times as great after allowing for provincial surcharges, payment in lieu of corvée, outright misappropriation and differences in prices. Again, that doesn’t invalidate the paper’s argument, but it moderates the implied differential, even without considering whether tenancy had already begun to replace peasant ownership on a significant scale, a process whose timing remains unclear.

A more serious shortcoming is the paper’s omission of comparisons between the burdens of English growers and their Continental counterparts. Limiting the exercise to England and China addresses one part of the Great Divergence, but what of the “Little Divergence” within Europe, or perhaps we should say the many little divergences between those countries that surged forward and those that lagged behind? What would estimates for France (where peasant burdens were notorious but urbanisation remained well behind England’s until the latter half of the 20th century) and the highly-urbanised Netherlands or less prosperous lands further east tell us? And what light might, for instance, be shed on the issue by a similar exercise involving British and French territories in North America or the Iberian colonies to the south?

A full comparison of peasant burdens among Europe’s economies alone would be a mammoth undertaking, fraught with still greater difficulty than the relatively clear-cut England-China case. But the example of France suggests that the results may not be so supportive of the Brunt-García hypothesis. Against the authors’ finding of a 23% burden on English farms (possibly on the low side, it must be admitted), that of French peasants has been put at up to a third of output – one of the many grievances that fuelled the Revolution. Yet French agricultural labour productivity remained far below England’s – perhaps £16 of output per person engaged, well over China’s £11 but just half of the English level – and the gap was widening. France was also considerably less urbanised than England, and again falling behind: as late as 1801 under a fifth of the French population lived in towns of 2,000 or more, no greater a proportion than in the England of 1700, and in the meantime England’s urban share (using the same threshold) had topped 35%.

Against the case of France we may contrast that of the Netherlands, where urban population in Holland proper had shot up as early as the 14th century at a time when rural exactions were modest, widespread peasant ownership reflecting easy terms designed to draw cultivators to newly-reclaimed land. By 1514 more than 35% of Holland’s population lived in towns of 2,000-plus, a level not to be matched by England for another three centuries (though of course on a far greater scale), and the province was already a world leader in terms of income. Yet agrarian tenancy only became widespread during the 16th century, with townspeople prominent among the new rural landlord class. City growth continued apace, it’s true, with Amsterdam alone booming from a respectable provincial town of 12,000 in the 1510s to a commercial metropolis of 105,000 in 1622 and 150-200,000 on the eve of the disastrous French invasion half a century later.

But crucially, Holland’s initial urban explosion wasn’t matched by neighbouring provinces with a less unburdened peasantry. Nor was the rapid income growth of 1400-1650 sustained from the third quarter of the 17th century, despite the putative rent stimulus to the industry of an innovative and highly productive farm population. Having quintupled in 1514-1672 to half a million, Holland’s urban population stagnated for the next century and a half. Agrarian productivity remained high, at around £30 per worker, the highest on the Continent owing to a highly developed dairy sector, though by 1770 somewhat behind England. But a comparison of France and Holland – or indeed between 15th- and 18th-century Holland – would yield the very opposite finding to the one suggested by the starker but less like-for-like England-China contrast.

At the end of the day we are left with the familiar chicken-and-egg dilemma. To put it crudely, did London’s population quintuple in 1600-1800 because the bloated land rents of Middlesex’s dwindling rural portion forced the county’s remaining farmers to produce more to feed their urban neighbours? It’s an absurd question, but illustrative of the wider problem of causality. London drew in its supplies from a far wider area, both domestic and international, and while its growth clearly profited from adjacent resources, it in turn impacted on nearby land values: Clark’s early 19th-century rent benchmarks show clear crests around London, Manchester and Birmingham, as might be expected from their leading role in Britain’s commercial and industrial advance.

Brunt and García-Peñalosa’s approach has definite appeal: along with literacy, the rise in European urbanisation well before the classic industrial revolution period remains something of a mystery, if not a cause of the later economic upsurge then at least an expression of forces that would later underlie industrial expansion – whether agricultural growth, diversity and exchange, Allen’s trade-driven high-wage economy or Clark’s “survival of the richest”.

the authors have offered a stimulating avenue for future research, though their approach shares the limitations of all such attempts at monocausal explanation. In fact they could have gone one better by investigating the implications of their tax-and-grow scenario for Allen’s alluring (though itself not fully explained) hypothesis of an exceptionally commercialised economy driven to labour-saving innovation by the cost of its own workers, indeed by its very success. Then we might really be on to something, even if only as a partial answer to the hugely complex question (as Brunt titled his 2000 comparison with France), “Why England?”.

Thursday, 16 October 2014

A darker continent

Patrick Manning has some interesting things to say about African population growth in the eighteenth and nineteenth centuries (in press; earlier paper with Scott Nickleach here): whether his conclusions will find widespread acceptance is another matter.

Manning’s latest addition to the growing body of scholarly speculation concerning Africa’s demographic past continues the recent trend toward ever higher estimates of pre-colonial – and here also colonial – population. In place of slow growth interrupted by the devastating impact of slave trading, we now face two-and-a-half centuries of near-stagnation giving way to sluggish recovery.

Where Frankema & Jerven proposed something just under a doubling of the continental total in the century to 1950 – itself a pessimistic growth assessment compared to the earlier guesstimates of McEvedy & Jones and (to a lesser extent) Caldwell – Manning offers a picture of overall decline in the century to 1880 followed by an increase of little over half over the next six decades.

The picture isn’t one of unrelieved gloom, though it comes perilously close: the northern and southern ends of the continent get to grow throughout the nineteenth century (though until 1920 at a pitifully slow rate), while the Guinea coast – the first region to feel the impact of European slave shipments – more-or-less holds its own after the post-1792 decline in removals to the New World.

All present-day estimates of Africa’s mid-twentieth century population seem to agree broadly that the continent contained around 280 million people in 1960 and 220m or so in 1950. There the agreement ends. For 1920, Manning’s estimate of 159m compares with the 147m of Frankema & Jerven, Caldwell’s 142m, and fewer than 135m implied by MacEvedy & Jones. Further back in time, the gap widens: in 1900, 145m (Manning), 137m (Frankema), 129m (Caldwell), 110m (McEvedy); for 1880, 142m, 128m, 120m and under 100m respectively. Manning’s total for 1800 is fully twice McEvedy’s, and 50% greater than the level indicated by Caldwell.

The sources of these large discrepancies are inevitably complex, but for the pre-colonial era they boil down chiefly to the degree to which slave removals and related deaths were offset by demographic recovery, ongoing growth through continued expansion of cultivation, and later the spread of new crops and (toward the end of the period) the beginnings of economic development. For the colonial period, the principal issue is the extent to which early census returns underreported total numbers.

Taking the latter period first (since all the estimates are essentially back-projections from the more reliable data for the 1950s and subsequent decades) there is little disagreement that colonial censuses – many of them barely worthy of the name – generally understated African populations. Contemporary estimates around 1950 indicated a continental total of only around 200 million, roughly a tenth below the true level. Nigeria’s population was widely believed to be only around 25m before the 1952-53 census returned a population of 30m, itself an undercount.

Manning is thus right to raise many of the official colonial population returns. But his procedure goes far beyond mere adjustment of deficient counts and government estimates: what he has done is effectively to discard all the pre-1950 data on the basis of a glib rejection of a few patently flawed guesstimates from the 1930s. This overlooks the wealth of intervening scholarly and indeed bureaucratic revision. European colonial officials were themselves aware by the 1930s of the shortcomings of their raw data, limited as they were by meagre administrative resources and legitimate native distrust of head-counts: the author of Nigeria’s 1931 census report for instance inflated the crude return by a tenth to compensate for under-enumeration and evasion. (Nor were earlier errors in population estimation all in the same direction, unless one is to accept figures of up to 4½m for Uganda in the 1900s.)

For the thus abandoned contemporary figures Manning substitutes assumed “default growth rates” which are themselves highly questionable. For these he draws on trends from the more complete census data for British-ruled India, which he then adopts as maxima for Africa given the continent’s disturbed condition prior to 1920. But this overlooks the very different character of the two regions: India was a long-settled society already boasting extensive dense occupation and highly developed state structures long before the Atlantic slave trade: Africa, by contrast was still in the throes of internal agricultural colonisation, as Caldwell concluded in his 1985 General history chapter (favourably cited by Manning), basing his projections on the assumption that:

the neolithic revolution has been slowly moving through sub-Saharan Africa for three thousand years bringing with it more intensive land use and denser settlement.

Furthermore Caldwell considered the resulting population growth to be accelerating in the nineteenth century through expansion into the forest belt and the spread of new crops (though the latter process was to be more marked during the colonial period). To these developments one might add the ongoing movement of Nguni and other Bantu-speaking peoples into today’s South Africa, nineteenth-century growth in Egypt and the beginnings of European settlement and agricultural transformation. Such an evolution has important implications for long-run estimates, because African population must in the past have been a good deal less than at the start of the colonial era, even allowing for intervening losses to slaving.

Manning’s default rates are not themselves obviously outlandish, the lower bound of his 0.2-0.3% pre-1920 annual range corresponding as it does to the increment needed to raise McEvedy’s “optimistic” 16½m Africans of AD1 to the billion of 2010: indeed given annual growth well in excess of 2% since the 1950s, rates must have been a good deal lower even than this for most of Africa’s past. But to assume such sluggish growth into the modern era reckons without the falling continental population share of the (until 1800) slower-growing north and the geographically ever more constrained hunting & gathering peoples to the south. It may be, of course, that sub-Saharan cultivators’ rate of increase fell markedly following their initial expansion through the southern half of the continent, but this does not appear to have been addressed, nor is there an especially strong case for it given that the global erosion of non-farming populations is likely to have been replicated on a smaller scale even in and around already settled areas.

While growth rates before the twentieth century remain a matter of conjecture, there is far less basis for the severity of Manning’s wholesale downward revision of those for the colonial period. While census-taking was at best patchy and in some areas subject to deterioration, the data for 1910-50 offer a consistent enough picture of quickening growth. That annual growth in the 1950s in most territories comfortably exceeded 2% a year itself suggests that there is nothing intrinsically implausible in rates of 1% or more in the century’s early decades or even of 2% in some areas from the 1930s. Manning’s default rates may be reasonable for the centuries to 1800, but appear at odds with the mounting demographic evidence as we move into the census period, conflicting even with the Indian evidence on which they are supposedly based.

The impact of Manning’s gloomy assumptions can be seen most clearly in the case of Egypt and South Africa, generally considered the continent’s fastest-growing nineteenth-century territories. Where French observers reckoned 2½m Egyptians following Bonaparte’s arrival in 1798 – since raised by twentieth-century scholarship to some 3-5m – Manning estimates 10½m, more than were counted in the census of 1897, usually considered the first reasonably accurate enumeration. For South Africa, his procedure gives 6.3m inhabitants in 1800 against only 5.2m counted in 1904 (the latter doubtless an underestimate, but coming after a century of colonisation both black and white): though probably an understatement like many of his numbers, McEvedy’s figure of a mere 1½m for the earlier year looks far more plausible given that much of the interior remained to be settled, particularly its western half.

There is a further problem with Manning’s projections: recall that these are his “default” rates, extended to the entire period to 1920 on the grounds of the continent’s experience of slave shipments and conquest by European powers. But what he then does is to apply a range of “situational modifications” representing (among others) these same factors, thereby effectively double-counting the losses and disorders which underlie his pessimistic global model. It is the compounding of these various elements which produces the pre-1890 population standstill, where a more plausible underlying growth rate subject to similar modifications would have shown a century of modest but quickening growth, preceded it is true by net losses in at least parts of the continent in the latter decades of the eighteenth century.

In sum, Manning’s estimates are an interesting but seriously flawed contribution to an area of historical demography in need of more work, on colonial demography and on the impact of slave removals & raiding on African populations. By selecting a set of growth rates and countervailing adjustment factors which effectively preclude dynamic development anywhere until well into the last century, he has constructed a model of built-in stagnation which inadvertently minimises Africans’ regenerative capacities and all but ignores widely divergent trends within the continent. There may well be grounds for raising all estimates of past African population, but approaches which offer so little scope for directly observed data and local variation are unlikely to offer a lasting way forward.

Tuesday, 22 October 2013

You guesstimate three tonnes, and what do you get?

Offline for a while, but back in time to catch up with Bolt & van Zanden’s “First Update of the Maddison Project”. And what an update it is: away with European per capita incomes of $450 or so (in those wonderfully descriptive 1990 dollars, of course!) – now it’s $600 or bust for any cutting-edge early-first millennium AD economy worthy of the name.

And it gets worse. For 1800, British per capita income is raised from around $1600 to $2100 – still below the Netherlands, now up still further at $2600, a level not reached according to Maddison until the return of rapid growth in the 1860s.

So just where would $600 in “1990 Geary-Khamis dollars” come from before the Roman Imperial economy had even necessarily peaked, let alone when Europe might be well past the imagined economic halcyon days of the early Principate? Remember we’re talking the equivalent here of four tonnes of grain net per head of population at 1990 international market prices, a level of real output not reached in current-price terms until the later Industrial Revolution in mid-nineteenth century Britain and the US.

Now it's true that G-K dollar values aren't necessarily meant to work in such terms: rather, when denominating real GDP they're intended to reflect economy-wide purchasing-power parities, but in such a way that the resulting aggregate can no longer be used to derive individual sectoral output values. This caveat applies doubly to Maddison-style extrapolation of modern-day PPP-adjusted GDP figures into the past on the basis of local GDP growth rates.

So far, so good. But the results for individual points and areas should resemble those from independent benchmark observations based on the same price level, in this case that of 1990. The problem is that they don't. Maddison’s series routinely throw up far higher past income levels and correspondingly lower growth rates than those suggested by individual point estimates based on identifiable output. Far from reducing this discrepancy, Van Zanden & Bolt’s revisions have widened it, from the first century through to the nineteenth.

So is there some realistic basis for such a gung-ho addition to Angus Maddison’s already highly generous allowance for pre-medieval Europe? Or is this just the product of some dubious approximation to commodity-price-basket-deflated putative “real wage” estimates dismissed in their earliest incarnation by Postan as ”not worth the paper they were written on”?

Well it certainly isn’t coming from four tonnes of grain-equivalent in per capita product - any grain, you name it, it just isn’t there unless the authors can identify some towering sphere of economic activity that no-one’s spotted to date - one moreover capable of tripling the estimated worth of real product relative to one calculated from identifiable outputs: it isn’t there in medieval or early-modern England or France, and there’s no indication of it anywhere else prior to modern industrialisation.

The stock answer to this is of course "services", which inevitably assume a greater value in past times when their GDP contribution is re-based on modern values: in pre-industrial societies service-sector labour is cheaper relative to other branches of the economy because wages and prices haven't been dragged up by better-paying productive mechanised industry, the growth of skilled occupations and resulting inflated living costs of labour.

So valuing past or less-developed-country GDP in modern global or developed-country terms involves a big upward adjustment in the contribution of incomes from services. The problem is that the later the price base, the greater the potential distortion between countries and earlier point estimates relative to current-price estimates. Valuing output hundreds or even thousands of years ago at 1990 prices effectively compresses the range of past incomes by revaluing services with low productivity growth as if they were returning a late twentieth-century real income.

But that's not all that’s going on here. For one thing Maddison’s 0.3% annual increase in British per capita GDP over the bustling 1820s is here flattened further into 0.2% annual growth over the whole of 1800-25. The mind boggles: can it really be possible that the world’s leading industrialising economy performed so poorly during the middle decades of its key phase of early industrialisation when material output indices suggest a rate nearer 1%? Never mind Crafts & Harley’s comparatively modest revisions, even the dour Clark would surely be dumbfounded by a finding of such sluggishness.

And a discrepancy of such magnitude inevitably impacts on earlier estimates given the way these series are cobbled together. As we’ve seen, the would-be modifiers of Maddison’s admittedly rickety historical accounts assemblage are sometimes only too keen to splice together growth projections using procedures even shakier than the often cloudy data underlying the whole exercise. Nor is it at all clear just what valuation throughout in 1990 dollars can really be expected to accomplish.

Ultimately it has to be asked whether, for all their unquestioned scholarly worth, the academics of the Maddison Project are the best people for the task, given their differing approaches to past growth. Maddison’s own results to some extent involved an uneasy compromise between time-series projections and benchmark data. To deepen the confusion risks shoehorning disparate findings into a form for which they are ill suited.

Thursday, 7 October 2010

Lost in Podolia

Lately catching up with Andrei Markevich and Mark Harrison on Russian/Soviet national income from 1913 to 1928, I’m impressed at the authors’ readiness to dirty their hands filling in the yawning chasm between our available benchmarks for a society transformed in the interim by war, revolution and chaos. I’m less than entirely convinced though by some of their choices in an exploration necessarily hedged to some extent by assumptions in the absence of comprehensive data.

It’s a huge topic, covering the economy of a nearly tenth of the world over a period of traumatic political & social upheaval and rebuilding, complicated by statistical uncerainties throughout and by the legacy of past manipulation and politicisation. Harrison and Markevich try to get to the truth by stripping the economy down to its nuts & bolts, with output series for key sectors weighted according to Falkus’s estimates and brought into line with Gregory’s 1913 national income figure by means of a further allowance for services.

For the most part the data are derived from existing production series, with interpolations for years for which firm figures are missing. Strictly the approach yields an index of gross output rather than value added, but it’s a tried & tested method that underlies most pre-20th-century estimates and for most countries remains the best we have. The resulting totals persuasively flesh out our hitherto sketchy impressions, broadly supporting the accepted picture: aggregate net national income for the territory of the interwar USSR fell by three-fifths in 1913-19, regaining its pre-war level in 1926/27, but income per head remained below the 1913 peak into the Plan era.

The calculation however involves some questionable assumptions which leave open the possibility that the drop may have been rather less precipitous and subsequent recovery more complete (though by no means complete in per capita terms).

First, in addressing the question of population, the authors rightly seek to correct the official population returns for what has long been known to be an ongoing cumulative overstatement arising principally from failure to deduct internal migrants from the estimated population of their former place of residence, while adding them to that of their new location. Deducting Finland and Poland from the population total for the "censused" part of the Empire, they then deduct a “compromise” 5½% to correct the official data, observing that this corresponds fairly closely to the findings of R I Sifman, though the resulting 152m for mid-1913 in fact falls short of Sifman's implied total by upwards of a million.

The authors’ next step is to arrive at a population for the interwar USSR by excising the areas lost after the Revolution: the later Baltic republics, western Belarus & Ukraine, Bessarabia and smaller areas of Transcaucasia. Here, Markevich & Harrison arrive at 19.7 million for the population of the ceded territories, concluding that the interwar USSR area contained 134.6 million people in 1913. But the figure for the lost provinces is inflated by the erroneous inclusion of Podolia, which instead remained a part of Ukraine throughout the USSR’s existence.

Deducting Poland and the corrected estimate for the lost territories from Sifman’s Empire total (which already omits Finland) and adding Khiva & Bukhara (not covered by the Imperial returns) yields a 1913 population of not 134 million but just under 140 million for the USSR area, very close in fact to Lorimer’s 1945 finding which put the ceded provinces at only 14.9 million in January 1914. The result underlines the unwisdom of applying a blanket correction factor across the Empire: while Szulc finds a 7% overcount in Poland, the interwar USSR included the principal receiving areas for internal migrants, so it requires a smaller adjustment than the Empire as a whole or even its non-Polish part. The error doesn’t affect the constant-area national income figure, but it threatens to distort the implied per capita trend.

One assumption that does affect the national income total relates to agriculture, where the authors accept Gosplan’s later upward revisions of pre-Revolutionary crop output. The modification has been widely questioned, as Markevich & Harrison acknowledge, but they propose its retention for 1913-19 in order to being the earlier data into line with the returns for the 1920s. They may be correct in so doing, but most sources retain the unadjusted returns. The Soviet authorities themselves seem later to have abandoned the correction, though this might be dismissed as an attempt to play down relative Soviet underachievement. Naum Jasny, among Soviet agricultural performance’s fiercest critics, seems to have found the original Imperial data satisfactory. The net impact could be to understate 1920s national income by 5% relative to 1913.

The paper’s assumptions don’t all point in the direction of higher pre-revolutionary per capita output. On the perennial question of product quality, the authors make no downward adjustment to Soviet output, observing that while some doubtless fell below pre-revolutionary standards, other sectors shared to some extent in wider technical advance - which might be read as a polite way of noting that the Russia of 1913 was itself hardly famed for cutting-edge finery.

An error that doesn't affect the constant-area national income trend but instead overstates the "Empire" series is the authors' application of the Falkus/Gregory aggregates for the Empire to their own "Empire excluding Poland and Finland". Falkus and Gregory indeed exclude Finland, as did the contemporary imperial returns - but they include Congress Poland, representing nearly a tenth of the total in the truncated form used by Markevich & Harrison (ie following Kholm gubernia's detachment in 1912). The smaller Empire on which the latter base their income figures may have reached the higher income total, but the estimates cited in the paper suggest something lower than the authors' findings. Happily the error doesn't affect the USSR series, which the authors base on Falkus's own Empire-to-Union conversion, itself a good deal more reliable than Gregory's.

All in all it’s a worthwhile effort, let down by some decidedly rickety & inconsistent population estimates and inattention to geographical coverage which could overstate the 1913 Soviet-area per capita income by as much as 4% relative to the 1920s, in addition to a possible far greater over-statement of pre-Revolutionary crop output and high figures for the old Empire. Markevich & Harrison are to be commended for tackling a too long neglected topic, but it remains one which would benefit from closer investigation.

Friday, 24 September 2010

Blame France?

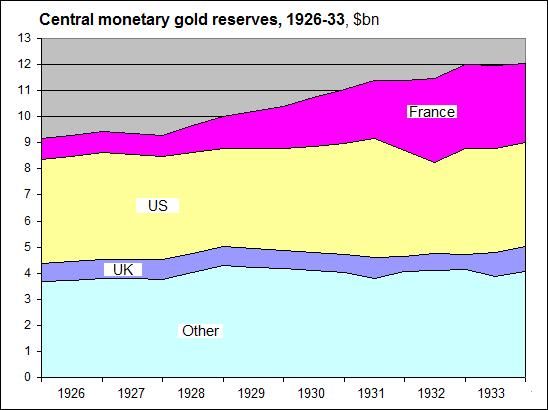
Douglas Irwin isn’t out to spearhead Franco-American rapprochement. “Did France cause the Great Depression?” he asks, and there’s more to the proposition than foreign-policy sour grapes. From 1928 to 1932 the Banque de France gobbled up virtually the world’s entire supply of new central-bank reserve gold – $2.5bn of it – effectively “sterilising” it (i.e. not issuing new money in proportion) when other countries needed it to back up monetary expansion to stave off deflation. The effect was to execerbate a severe global deflationary spiral that lasted until 1933 when the US at last followed Britain in abandoning the gold standard.

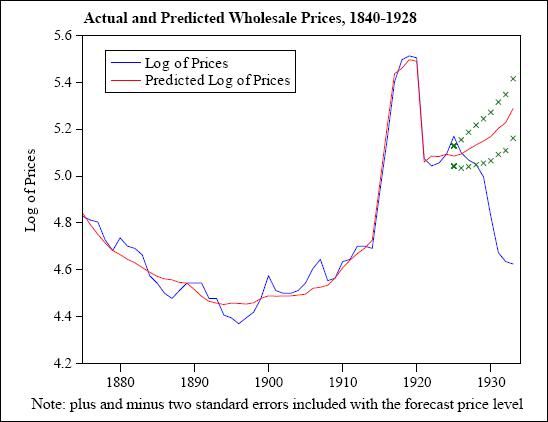
Irwin doesn’t at all exonerate US monetary authorities of their share of responsibility for the slump: rather he finds that while the two countries were equally to blame in the first half of the period, France was the culprit after the US reversed its own gold hoarding in 1931. It’s not an entirely novel perspective: Irwin cites contemporary expert warnings of the dangers of French & US conduct even as prices seemed to be stabilising in 1928 and the first half of 1929. What’s new is his finding that world prices would have risen in 1929-33 rather than plunging, had France and the US merely maintained their 1928 ratio of reserve gold to money supply. The associated graph is striking, but not entirely convincing: for one thing, it doesn’t explain falling prices in 1925-28, when French and US gold holdings were reasonably well-behaved and world gold reserves rising broadly in line with economic output; it also doesn’t show what the projected price trend would have been under the same assumptions but with no additional monetary gold from 1928, as was effectively the case. Even with the average world economic growth rate of around 3¾% annually over 1922-29, an absence of extra “active” gold would seem insufficient to account for the scale of the subsequent collapse of prices – and that’s before taking into account the reversal of real output growth in the early 1930s. But it certainly didn’t help.


In fairness to the French, it should be remembered that despite converting a large part of its sterling holdings into gold from 1927, the Banque’s reserves still suffered through Britain’s effective 30% devaluation in 1931. If – as most commentators seem to agree – sterling was indeed overvalued by something like a tenth in 1925, then gold indeed made more sense than at least one of the world’s notional reserve currencies. French gold hoarding of course contributed to sterling’s difficulties, so it’s not much of an excuse. And the franc was itself widely regarded as undervalued from 1928, making the country already a gold sink. Though cushioned to some extent against the first impact of the 1929 global economic downturn, France was to pay dearly for its attachment to gold as she entered the worst phase of the depression just as many countries were starting to climb out of it in 1933: not until 1936 did the country finally free itself of what Keynes had dubbed the gold “fetish”, the last power to do so. By 1938 France’s share of world gold reserves was down from its 1932 peak of 28% to just a tenth.


What are we to make of it all? Well, for one thing proclaiming a new international regime doesn’t make it so without the mechanisms to implement it. Could the gold exchange standard have worked as envisaged at Genoa in 1922? For a time, no doubt, with better alignment of the key currencies and binding undertakings to play the game: supply of the required metal was to prove adequate in the 1930s, as it could have been in the 1920s. But by then it was too late: the inflexibility implicit in the attempt to return to gold and the impossibility of ensuring its optimal distribution had crippled not just the monetary system but the wider economy. Would a more internationally-minded Banque de France have spared the world the nightmare of Depression and war? Possibly not: there was far more amiss in the interwar economy than just monetary policy and gold stocks. France may not have caused the Depression, but it made things a lot worse.

Friday, 17 September 2010

De-industrialisation then and now

De-industrialisation is back on the political agenda with the continued erosion of manufacturing employment and GDP share in western economies during the recent economic downturn. US manufacturing employment has fallen by nearly two-fifths from its 1979 peak, standing today at roughly the level of the 1940s despite the intervening doubling of the US population. And the pattern is broadly repeated across the developed world. The UK has seen perhaps the steepest drop, from 9 million in the 1950s and 6.9m in 1979 to a mere 2.5m today.

Shares of current-price GDP overstate (perhaps doubling) manufacturing’s constant-price output decline relative to other sectors because of differing cost and price movements with in the economy. But the pattern is clear enough: for the developed countries as a whole, manufacturing’s share of GDP has halved in the last half-century to around 15%. From an all-time peak of 30% in 1943 and a peacetime high of 28% a decade later, the sector’s share of US GDP has fallen since the late 1960s from a quarter to a mere 11% in 2009. In Britain the proportion has plunged from 37% in 1955 to just 12%. France has seen a less precipitous decline, while Japan and Germany have kept their share above a fifth, down from around a third in the 1960s. The former USSR and eastern Europe experienced their own abrupt fall in the 1990s, coupled with severe drops in real GDP in the early part of the decade.

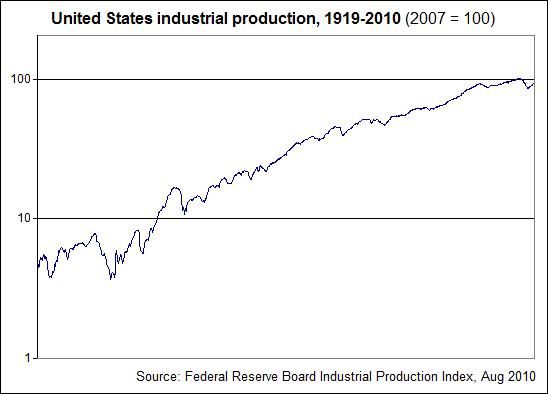
The absolute volume of output has of course shown a quite different trend to employment or GDP share, quintupling in the US since 1953 according to the Federal Reserve’s industrial production index, despite a slowdown from around 1970 and indications of another since 2000. Except in Britain, where output has only doubled, manufacturing in the west as a whole has followed a similar trend, with Europe lagging by a decade or so. But European economies too show signs of the deceleration in manufacturing growth following the high rates of the first postwar decades.

So today’s de-industrialisation is something of a misnomer in terms of output, where until the downturn of 2008 the sector continued to enjoy growth of 20% per decade in most of the older industrial countries. Output decline is – except in some of the worst-affected transition economies – only relative. The sector’s comparative eclipse is in part a manifestation of growing affluence, as an ever larger proportion of our rising spending goes on consumption of services, much as demand for industry’s output surpassed and ultimately dwarfed that for agricultural produce in 1780-1950. In terms of jobs, however, the phenomenon is a very real one for the millions displaced, often in localities heavily dependent on industrial earnings and with limited alternative job opportunities.

But de-industrialisation is itself nothing unique to the past six decades. Today’s shift of the centre of gravity of world industrial activity from richer toward poorer countries is only a reversal of the nineteenth-century trend which saw traditional manufactures driven from mass markets by cheaper factory goods. The difficulties facing older industrial economies today offer striking parallels to those encountered by producers in less developed countries in the earlier period. Problems of erosion of overseas market share and competitors’ encroachment on raw material supply were faced too by Britain in the later 19th century as the country lost its initial dominance in mechanised production, even while its factory output growth averaged 2¼% a year.

The scale of manufacturing production before modern industrialisation is notoriously difficult to gauge, even in more developed countries. Official returns until the 1950s tended to measure the output only of factories and workshops exceeding a given number of workers or value of output – sufficient to indicate 20th-century growth in industrial countries, but a poor guide to the pattern in traditional ones where manufacture tended to be more dispersed among small producers. Isolated estimates exist for parts of pre-industrial Europe, and even for regions of 19th-century India before the advent of modern census-taking. For England, we have reworkings of Gregory King’s calculations indicating nearly £8m of manufacturing value added in 1688 (more than £1.4 per head or nearly a sixth of national income), showing a country already in advance of most of its competitors. Recent research on occupational distributions has supported the existence of large “pre-industrial” industrial populations. But global manufacturing volume before the past half-century or so has remained a largely overlooked topic, with one notable exception.

Before we had Angus Maddison’s historical GDP estimates, there were Paul Bairoch’s figures for manufacturing output for the world and principal producing regions & countries for the period 1750-1980. Whenever you encounter a statement to the effect that 18th-century China produced a third of the world’s manufactures or India a quarter, it’s from Bairoch. Like Maddison’s data, Bairoch’s have become so embedded in discussion of long-run economic growth that they’re routinely cited with no indication that they might be anything but 100% accurate, and sometimes without even any identification of the source: to many they simply are “the” numbers.

In fact Bairoch has come in for considerable scholarly criticism over the years, not least for vague indication of sources and for guesstimating output levels before modern industrialisation. But his actual estimates have never been overturned: on the contrary, his finding of massive de-industrialisation in less developed countries has received indirect support from Maddison’s GDP data and more recently from Pomeranz’s finding of an 18th-century Chinese economy quantitatively not dissimilar to Europe’s: Maddison’s figures indeed indicate (rather implausibly) a Chinese economy larger (though of course far poorer in per capita terms) than that of the US as late as 1888.

Bairoch took a very different approach to Maddison (at least in theory), rejecting projection into the past of apparent growth rates as an unreliable indicator of early output levels. Instead he guesstimated plausible consumption of manufactures in pre-industrial societies, adding subsequent factory production and making a deduction for the part of traditional output supplanted by imports. In practice, Maddison has of course spliced similar benchmark observations into his GDP growth series for points far from his notional 1990 benchmark, hence the substantial compatibility of the two sets of data.

The first thing to be said of Bairoch’s “pre-industrial” numbers is, like Maddison’s for China and India, they’re big. Bairoch was sufficiently aware of the enormous pricing pitfalls in valuing output over time to limit his results to a volume index based on the UK’s 1900 level of manufacturing output. But since we know the approximate value of British manufacture in 1900 (and can indeed fairly reliably estimate that year’s global manufacturing value on the basis of existing national accounts calculations) we can value his global estimate for 1700 at roughly $5bn of gross output at 1900 prices – a vast quantity implying perhaps $2¼bn of value added, around a seventh of total world product and indeed little smaller a proportion than in 1900.

The focus of Bairoch’s work is however not so much the global trend but the geographical distribution of manufacturing activity. Here his conclusions are startling: Chinese output exceeded the whole of continental Europe’s (including Russia but excluding Britain) as late as 1830, while India produced nearly as much as Britain, France and Germany combined. The west’s subsequent de-industrialisation impact on Asia was still more startling: Indian output of manufactures fell by 73% in 1830-80, China’s less abruptly – by 39% over 1830-1913 - but by a similar absolute volume exceeding a billion dollars in annual gross value. Overall the non-European world (excluding Japan) lost some 47% of its manufacturing capacity, its share of world output plunging from 73% in 1750 to a mere 7% two centuries later.

It’s a shocking picture, but one resting on uncertain foundations. Taking the classic case of 19th-century de-industrialisation – India’s traditional cotton industry – it seems that while handspinning production indeed followed the course outlined by Bairoch’s data, its decline was partly offset by the expansion of mill output in the second half of the century, while the sector’s weaving branch fared better. Millions still lost their livelihoods and the country was for a time reduced from a leading world exporter to an industrial backwater as industrialisation took off elsewhere, but there is no evidence for quite the scale of output collapse portrayed in Bairoch’s estimates. Albert Feuerwerker has found a similar pattern in China, where his calculations indicate that traditional weaving grew slightly over 1870-1910 on the strength of mill yarn imports. Nor was this a distinctly Asian phenomenon: numbers in English handloom weaving had likewise risen in the early 19th century even as handspinning was becoming a thing of the past.

Textile products represent only a fraction of manufacturing. But in the first decades of the 19th century they represented the most dynamic sector in the transition to mechanised factory industry, accounting for half of British exports in 1830. If any traditional industry faced oblivion at the hands of British and later western European and US competition, it was handicraft cotton manufacture. The implication is that Bairoch overstates both Asian manufacturing output in the 18th and early 19th centuries and the scale of its decline from 1830. His other figures are, however, broadly of the right order of magnitude, and illustrate the retreat of traditional production not just at regional but at global level, from perhaps an eighth of global value added in 1700 to a mere 3-4% two centuries later.

And de-industrialisation has a history even older than the era of the industrial revolution. Gregory Clark finds evidence of relative decline in non-agricultural employment in areas of rural East Anglia as early as the 14th-16th centuries:

While only 39 percent of the employed in these parishes were in farming in 1381, by some of the decades in the early seventeenth century this share had risen to nearly 70 percent. Rural Suffolk was more “industrialized” in 1381 than in any years observable 1550-1700 up till 1831. Rural Suffolk seems to have experienced “de-industrialization” between 1381 and 1600.
The story is repeated across early-modern France, Germany, Iberia and Italy, as new manufacturing districts arose to supplant rural crafts, or as competition from regions with more direct access to the centres of the new Atlantic economy brought a wholesale shift to the north and west.

De-industrialisation has been with us for many centuries. What’s new is the rapidity and scale of the downturn in manufacturing employment in parts of the western world over recent decades. History offers no miracle cures: few will want to emulate the “sink or swim” laissez-faire approach which saw the permanent loss of a quarter of Britain’s manufacturing jobs in 1979-83 alone, but protecting or shoring up declining industries has usually tended only to postpone eclipse in the absence of ongoing active promotion of research, modernisation and expertise. Britain’s 20th-century experience should serve as a warning against complacency and reliance on compliant markets: in the 21st there may be no place for rich countries’ products without constant effort to maximise the skills, innovation and creativity that gave them their initial lead.

Wednesday, 8 September 2010

Trading myths

Discussions of past world trade abound with widely diverging calculations, surely enough to have estimators of GDP congratulating each other on the closeness of their findings.

According to Kenwood & Lougheed (The growth of the international economy, 1971),

By 1913, the volume of foreign trade per capita had grown to over 25 times what it had been in 1800, whereas world output per head had grown only 2.2 times over the same period. This means that during the period 1800-1913 the foreign trade proportion, that is, the ration of world trade to world product, rose to over 11 times its initial level. Moreover, if, as seems likely, the world proportion of foreign trade to product was about 33 per cent in 1913, it must have been barely 3 per cent in 1800.

The authors were referring to total foreign trade, in other words the combined figure for exports plus imports. Since this totalled around $40bn in 1913, their implied world product works out at roughly $120bn. And as world population had nearly doubled in the meantime, their estimate implies for 1800 a world product approaching $28bn and trade totalling $0.8bn at 1913 prices.

In 1995 Angus Maddison came up with a far lower ratio for 1913 of 8.7% of GWP for exports alone, which he lowered still further in 2001 to 7.9%, up from 1% in 1820 and 4.6% (originally 5%) in 1870. Since he also estimated current-price exports at $18.4bn in 1913 and $5.1bn in 1870, this implies a gross world product of $230bn in 1913 and $110bn in 1870, when prices were rather higher before the onset of the “great depression”. However, his ratios are computed at 1990 prices, which as we’ve seen aren’t necessarily the best guide even to the first half of the 20th century, let alone the 19th. Maddison offers no current-price figure for exports in 1820, but his volume estimate broadly agrees with Mulhall’s sterling value for total world trade in suggesting around $0.8bn - a value that is difficult to reconcile with Maddison’s 1% share of GDP, even given the eccentricities of 1990 Geary-Khamis dollar projections and the high prices of the 19th century’s opening decades.

Maddison’s estimates have become the standard in much of the literature, notably in recent work by Kevin O’Rourke, Jeffrey Williamson and Alan Taylor, who use them to show that exports grew more rapidly relative to GWP before 1913 than since. But are they reliable? The answer depends on what we’re measuring. As independent projections of two distinct variables from a 1990 base they may each possess some validity. But whether the resulting ratio corresponds to reality is another matter.

Fortunately a check is available, in the form of current-price data for leading countries and estimates of world trade at both current and constant prices from the 1870s. To take the most obvious case, the exports of Britain - the leading trading nation of the 19th century - are put by Maddison at 3.1% of GDP in 1820 and 12.2% in 1870. But at the prices of the time, the proportion (excluding re-exports of £10m and £45m) rose from around 9% to a fifth. For the US, exports reached 3.7% of GDP in 1913 according to Maddison’s series, but at that year’s prices were around 6½%: the corresponding ratio for Germany is likewise understated by upwards of a fifth, for France by half; China fares still worse, even reckoning GDP at the most generous level compatible with likely output.

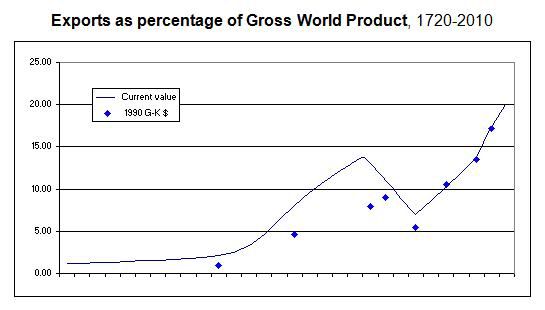
Mulhall’s trade data on the other hand appear consistent both with Maddison’s current-price data and with the British returns extending back through the 18th century. His figures include Britain’s large re-export trade and presumably the transit trade of the Netherlands whose inclusion as undifferentiated exports irked 20th-century international statisticians, but they can be adjusted for both. He also combines imports and exports, so his totals need reducing by more than half to omit not only the double-counted merchandise but also freight & insurance costs. Expressed as a percentage of current-price world product, the results were combined with post-1870 data to yield the following decennial series (except 1913, 1929 and 1937):


The current-price estimates indicate that the 1990 G-K dollar data grossly understate exports relative to GDP in 1820, 1870 and 1913. The 1% level was probably reached around 1700 rather than 1820, when the real ratio was about 2%. The 1870 ratio similarly already exceeds Maddison’s 7.9% for 1913, when the true figure reached 13%. The discrepancy extends to 1950, for which Maddison inexplicably reduced his already somewhat low 7% to a calamitous 5½%.

Kenwood & Lougheed on the other hand seem to have been remarkably accurate all those years ago with their estimate of world output in 1800 (assuming that they started from accurate trade & population figures for 1913), though they underestimated both trade in the earlier year and GWP in the second. The intervening rise in the export ratio was not elevenfold but probably slightly less than eightfold.

While Mulhall's early estimates doubtless contain an element of approximation, this is not sufficient to greatly alter the conclusion, and there is no indication that he overstated "unknowns": if anything, non-western countries' share looks likely to be understated. Furthermore, the finding of far larger early-modern trade is supported by still earlier estimates such as Braudel's astonishing tenth of national income (upwards of 0.4% of world product) for 16th-century French imports (a good part doubtless for re-export).

One peculiarity of the Maddison series is its suggestion that exports outstripped world output in 1913-29, a notion which would have surprised contemporary experts: in fact at current prices the 1913 percentage was not surpassed until the 1973 oil price rise raised the total to $850bn - a still more shocking finding that calls for future investigation but which in view of postwar western liberalisation would seem to reflect faster intervening growth in services and in output of less trade-dependent regions more than policy or failure of the trading system.

In terms of volume, the data illustrate four familiar stages of export growth over the past 300 years: an annual increase of about 1% to c.1815, an acceleration to 3½% in the following century and then a period of near-stagnation from 1914 until the resumption of rapid growth from the mere $37bn of 1946, leading to the 5-6% annual increases of recent decades. Comparison of the century to 1913 with the one after is uninstructive as the second comprises three decades which form part of neither suggested period of globalisation: of these, the last showed faster growth, but the earlier trade surge produced a sevenfold rise in exports’ share of gross product.

On a speculative note, compared to Maddison's more linear 1820-1929 trend, the slowing of export growth from the high rates of 1830-60 lends the current-price estimates the appearance of a flattened S-curve interrupted in 1914 and with which the subsequently disrupted export/GDP ratio is only now once again intersecting as it approaches the former's implied upper bound of perhaps 30%. The slowdown of 1861-1913 of course owes much to the successive impacts of the US Civil War, the 1873-96 price depression and the rise of protection, but each of these in its own way reflects trade-related stresses suggestive of a finite tolerance for commercial openness at the aggregate global level. Much has of course changed in the intervening century, but it remains to be seen whether the 21st century resumes the trend of the 19th or continues that of the late 20th.

It seems clear that in real terms international merchandise trade was more significant in the early 19th century than the currently-accepted estimates allow for. That still means that nearly 98% of output supplied domestic demand in 1820, 99% in 1700. But the world was already a little more “global” than we’ve been led to believe, and was to remain so into the comparatively recent past. The resulting flattened growth trend may be indicative of future limits to trade globalisation, or of an ongoing structural break with past centuries.

Monday, 6 September 2010

1946 & all that

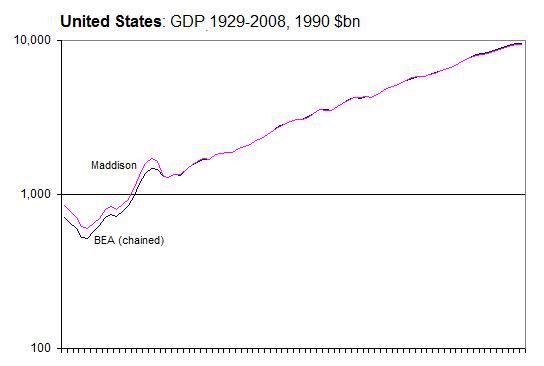
It was the last year of global economic contraction, as countries struggled to overcome wartime destruction & dislocation and postwar political strife, avert international food crisis and reconvert from military to peacetime production. For the United States, 1946 saw an exceptionally severe drop in real output as the nation dismantled its vast war apparatus and sought to return once again to "normalcy". Indeed while the rest of the world experienced little net change, Angus Maddison's data - widely used as the standard in historical GDP comparison - show real US GDP falling by more than a fifth, the sharpest annual downturn since records began.

That US economic activity fell sharply in real terms in 1945-46 is beyond question. Industrial output was down as early as April 1945 as the war in Europe neared its end. With Japan's surrender, the War Department cancelled contracts worth nearly $23 billion in August alone, and 2.5 million workers were released from war jobs in the first month of peace. The industrial downturn continued into 1946, and the peak wartime level of manufacturing activity was not reattained until 1950, a reflection of the scale of the country's earlier economic mobilisation.

What's at issue is the extent of the drop, both in the US and globally. Maddison's data show the 1990 Geary-Khamis dollar value of US GDP falling from 1.64 trillion in 1945 to little over 1.3trn in 1946. And this decline represents 7% of gross world product in 1945, enough to turn an otherwise small further decline from that year's already greatly reduced aggregate global output into a massive postwar world contraction.

But today's official US historical National Income & Product Accounts show no such calamitous plunge in the first year of peace. The answer comes from the Bureau of Economic Analysis, which in 1996 replaced its fixed-price real GDP estimates with chained indexes incorporating year-on-year price changes. The May 1997 Survey of Current Business explains:

As measured by the old 1987 fixed-weighted index, real GDP dropped 25 percent from 1944 to 1947, reflecting the post-World War II demobilization and the associated sharp cutbacks in defense spending. However, much of this drop reflects the use of 1987 prices for defense equipment rather than the low postwar prices for defense equipment. As measured by the more appropriate price weights of BEA's new chain-type indexes, the postwar drop in real GDP is 13 percent.

Maddison's GDP trend thus corresponds closely to the BEA series abandoned in 1996, with a base-year shift from 1987 to 1990. The effects are significant: in today's chained series, the GDP of 1945 was not equalled until 1950; according to Maddison, this didn't happen until 1953. The higher 1944 wartime peak was surpassed only in 1951 according to the BEA, but in Maddison's series the 1953-54 recession meant this took until 1955.

Nor is the impact in Maddison's data of merely national sugnificance: his series indicates a 7% fall in world output in 1946 alone, equalling that of the previous year when the ending of Allied war production combined with the devastation of German and Japanese industry & infrastructure. Replacing his US trend with the BEA's, however, the global drop is about 3% - far smaller than that of 1945, as we might expect given the ending of the world's largest and most destructive armed conflict.

And the effect isn't limited to the period of victory and postwar adjustment & overseas reconstruction. For Maddison's trend before 1946 broadly coincides with the BEA's. If the chained US series is correct, Maddison's 1929-45 US data are overstated by 10-20% or more relative to those that follow - and the discrepancy widens toward the beginning of the period covered by both sets. Which is doubly problematical, because there's good reason to believe that his figures for earlier years already understate the real US share of GWP.

The current-price data certainly support the chained series as a more appropriate representation of reality. Current-price GDP was virtually unchanged in 1946 (from $223bn to $222.1bn). Durable-goods manufacture was down sharply, almost entirely down to the plunge in output of ships & vehicles; government's share was down by an even greater amount as millions settled back into civilian life. But consumer-goods production was up, as were retail & wholesale trade, construction and services.

Prices were certainly up substantially with the lifting of wartime controls, a trend which would continue in 1947 and 1948. But the scale of Maddison's real-GDP downturn would require a rise of more than a quarter in the unit value of net output. It just isn't there. Consumer price inflation picked up sharply in the second half of 1946, but for the year as a whole averaged little over 8%. Commodity prices rose more strongly, but their greatest increase would come in 1947. The BEA's GDP deflator shows only a 12% rise, the same as that implied by the old 1947-price data. Real GDP therefore fell by 11%, again in line with the 1947 series.

Maddison himself was aware of the issue, admitting candidly that his preference for the 1987/90-price version derived in large part from his doubting a near-doubling of real US GDP in 1937-50. It's an enormous rise, but less daunting when we recall that per capita income in 1937 was still below the level of 1926, and that both his and the chained series indeed show such a doubling for the still briefer period 1937-44. The alternative of a real 25% drop in 1944-47 requires a far greater leap of faith.

If Maddison's 1870-1945 estimates of US GDP are misleading, his world totals cannot but be affected given the size of the US economy even in the late 19th century. Lowering them to conform to his 1946-2008 figures would however indicate an unrealistically low US share of a mere sixth of world output in 1913, when current-price data suggest something nearer to a quarter than Maddison's raw 19%. Adjusting the US series necessitates correcting the data for other parts of the world, some of which already appear overstated.

The 1946 problem should remind us that 1990 G-K dollars can be an unreliable guide in estimating historical GDP. The pricing issues can too easily leave us with implausible trends or relative volumes of output. The Maddison dataset and extrapolations from it should be used with great caution until we can come up with something better.