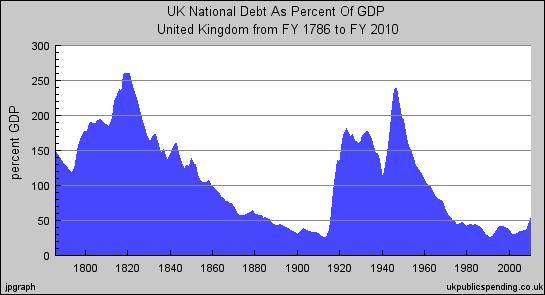
Reassuringly in these days of government debt spiralling toward 70% of GDP, it shows that the UK debt-to-GDP ratio topped 250% in 1818-21, and we survived that.
But did it?
On closer examination of the data underlying the graph, the debt shown for the four peak years averages £841.5 million (from Mitchell), while GDP is estimated at £323.8m. But the latter figure seems substantially lower than other calculations based on contemporary estimates. Following Lowe, Deane & Cole reckon the GDP of Great Britain alone at £288m in 1821 - to which must be added Ireland's £70m or so - while Officer cites estimates in excess of £400m for the entire UK.
Consideration of the growth and price trends strongly supports the higher income figures. Deane & Cole certainly underestimated their 1865/85-price national product in 1801-21, and to a lesser extent to 1861. Prices in 1819-21 were falling rapidly from the high levels of 1800-18, but remained high in comparison with most of the ensuing century. Aggregate output c.1820 is in real terms unlikely to have been much under half of the £600m estimated for the UK in 1851, while prices were perhaps 30% higher.
So it seems that the post-Napoleonic War UK debt burden peaked at rather under than over two and a half times GDP - perhaps 235% on the basis of Deane's estimate and 210% or so according to some of the higher figures. It's still reassuringly higher than today's projected 70% - and we're unlikely to face 30 years of falling prices as we struggle to reduce the burden.
Later: Here’s my revised version of the chart, reducing the original’s annual current-price GDP rise by two-fifths in 1821-30 and by half in 1800-11, and assuming (fairly arbitrarily) growth of 4% in 1786-93 rising to 5% in 1793-1800 with the onset of wartime inflation. The absolute value of debt has been left unaltered throughout, as have the GDP estimates from 1830 to the present.
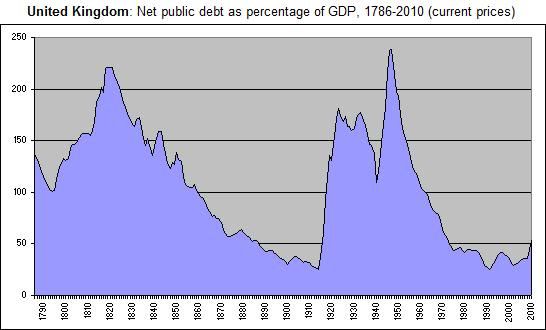
The peak ratio has now shifted from around 1820 to 1946-47 (237% and 238%). Price movements were certainly more helpful in bringing the burden down from the latter level: while it took until 1888 to get post-Napoleonic debt down to half of GDP, after World War II it took only until 1973.
No comments:
Post a Comment